Metamerism and metameric—these two words are used regularly in the global color development lab at Carboline. In fact, metamerism is one of the concepts that typically requires the most explanation in my field of work, especially as it relates to color matching for industrial coatings. It’s also a concept that really needs to be seen to be believed. An explanation of what metamerism is, and how it works, is generally warranted after we’ve completed a color match that is metameric to the customer sample that we’re tasked with matching.
What is Metamerism?
To understand the concept of metamerism, we must first start with a basic definition. In colorimetry, metamerism is when two colors that are not actually the same color appear the same under certain lighting conditions. This occurs because the colors have different spectral power distributions, which causes them to reflect contrasting wavelengths of light. Two colors that appear identical to the eye under one light source, but appear different under another light source, are metameric.
A great example of this is how two paint color samples can appear to match perfectly outside in the daylight, but then look completely different under the bright, fluorescent lights of a paint store. It may seem like a trick of the eye, but that’s metamerism at play.
Metamerism in Color Matching for Industrial Coatings
With industrial coatings, the difference between two metameric colors boils down to the actual chemical structure of the pigments used. The same final color can be achieved in a myriad of ways—and that sometimes involves using different types of pigments from what was used in the color sample that needs to be matched. When a color match is achieved in this way, you can end up with metamerism.
In color matching, an instrument called a “spectrophotometer” is used to measure the reflection of light in color. From this measurement, a standard graph will demonstrate the percent reflectance for that color at each wavelength of light in the visible range of the spectrum. Generally, this results in a reflectance curve like the one shown below.

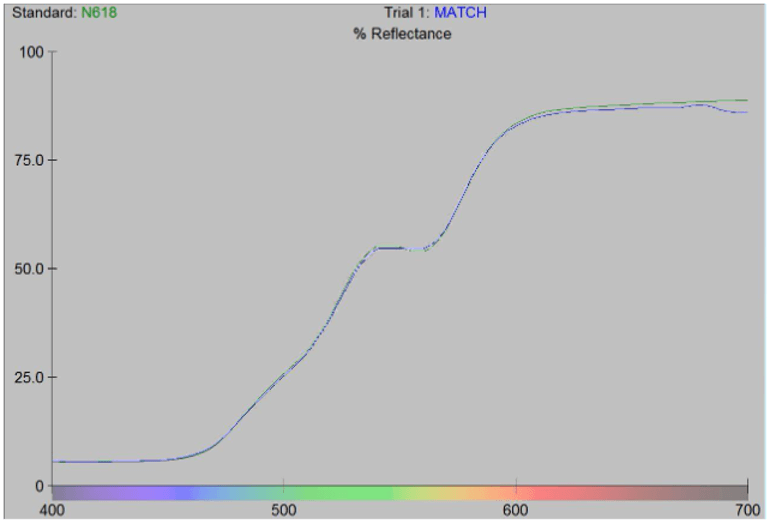
In simple terms, a standard curve is a graph that is created using data from known samples—such as those measurements collected from a spectrophotometer. When matching a color with industrial coatings, the ultimate goal is to get the sample curve to perfectly match the standard curve, as demonstrated in the graph below.

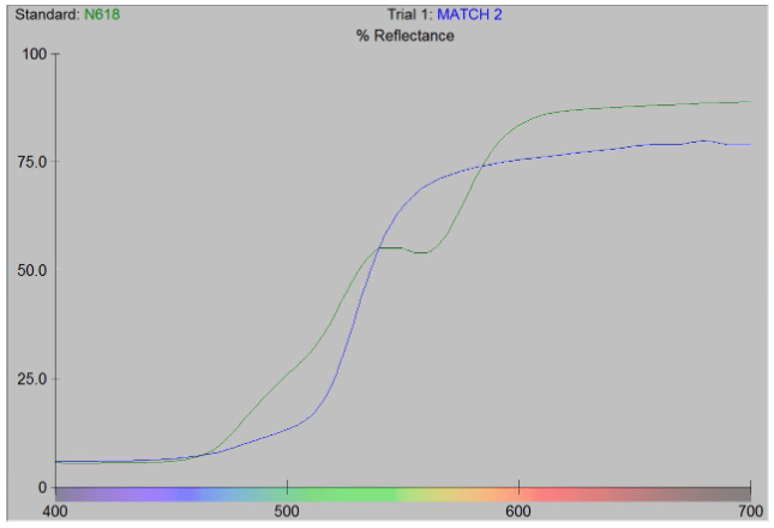
However, there are times where access to the exact same type of pigments that were used in the original match just isn’t feasible. This is where metamerism can come into play. Color matches that are metameric will have graphs with curves that don’t follow the same general shape. Instead, the two lines will cross each other at multiple points, ending up with a graph that looks like this:

When reflectance curves of metameric match are seen during the color matching process, the two colors must be visually assessed in daylight. When exposed to varying light sources, the difference between the two metameric color samples can be stark—demonstrating just how important lighting conditions are to the appearance of color.
